Lumos
Orbitrap Fusion Lumos Tribrid MS
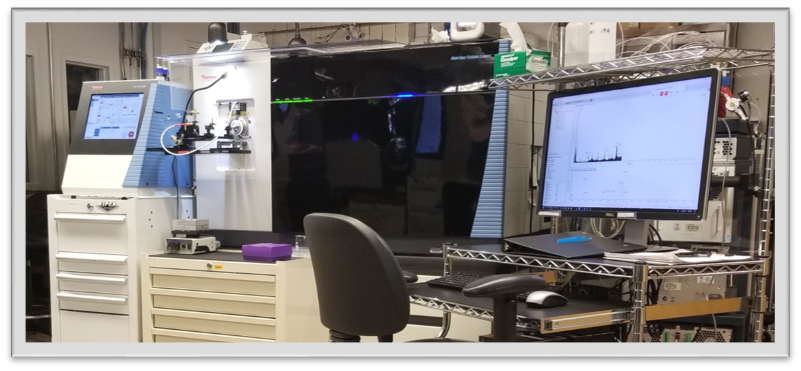
The Thermo Scientific Orbitrap Fusion Lumos Tribrid mass spectrometer combines quadrupole, Orbitrap, and dual-pressure linear ion trap mass analyzers, adding a higher-brightness ion source, a segmented quadrupole mass filter with improved selectivity and ion transmission, and improved vacuum over the Fusion. Typical applications include low-level PTM analysis, isobaric-tag multiplexed quantitation, intact protein characterization, and MSn of small molecules.
1/8/2016 Lumos Installed
Specifications
| Specification | Value |
|---|---|
| MSn scan rate, Orbitrap | up to 20 Hz |
| MSn scan rate, ion trap | up to 20 Hz |
| Resolution | 15,000 – 500,000 FWHM at m/z 200 |
| Mass accuracy | < 3 ppm RMS external; < 1 ppm internal calibration |
Features
- CID/HCD Fragmentation
- High Capacity Transfer Tube (HCTT) and Electrodynamic Ion Funnel (EIDF) for increased ion flux and lower limits of detection
- Segmented quadrupole mass filter allows for 0.4 u to 1200 u precursor isolation
- Ultra high field Orbitrap mass analyzer
- Spectral multiplexing for enhanced duty cycle
- Synchronous Precursor Selection Up to 15 precursors per MS2 scan, for MS3 analysis only
Parallelization on the Orbitrap Fusion
To improve the spectral acquisition rate the acquisition process on the Fusion Series is extensively parallelized. The figure below shows a schematic of parallel execution and event pipelining: Precursors identified in the Orbitrap full scan (top row) are fragmented and accumulated in the IRM (middle row) concurrent with LT acquisition of the previous MS/MS (bottom row).
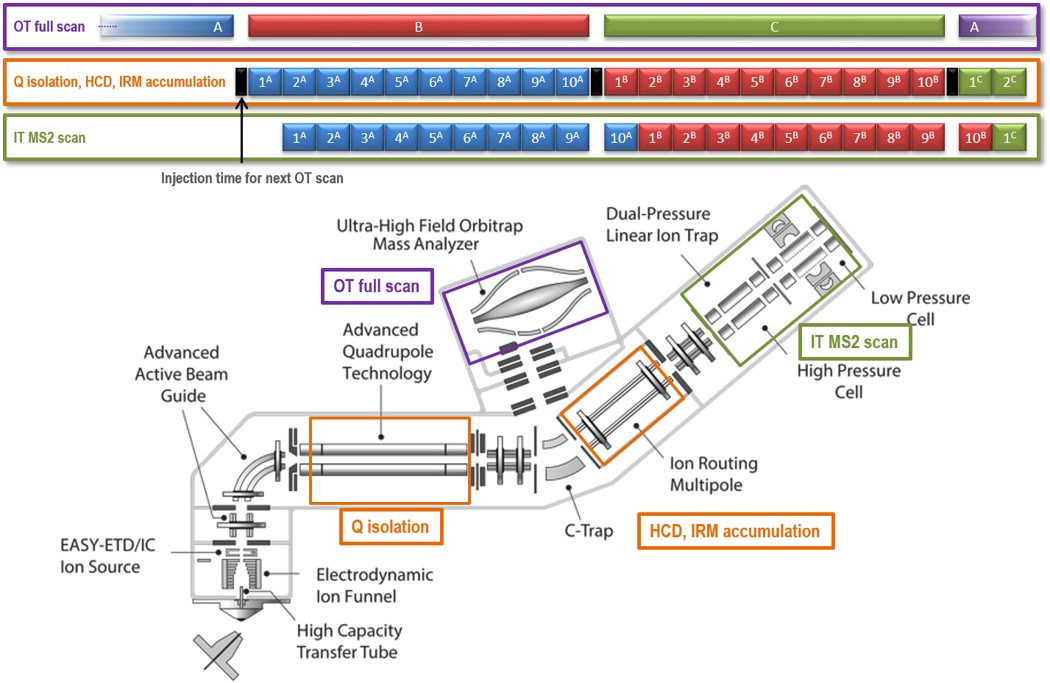
Senko MW et al. Novel parallelized quadrupole/linear ion trap/Orbitrap tribrid mass spectrometer improving proteome coverage and peptide identification rates. Anal Chem 85(24), 11710 - 4 (2013)
AGC control on Orbitrap Fusion Series Instruments
Automatic gain control (AGC) regulates the number of ions delivered to the Orbitrap and linear ion trap so each scan hits its target ion population. Before each master scan the instrument runs a fast, hidden ion-trap “prescan” (not recorded in the raw file) that measures the incoming ion flux; injection times for the scans that follow are calculated from it.
- Data-dependent experiments: the prescan uses the master scan’s settings and runs immediately before it. Precursor identities (m/z and charge) come from the previous master scan, but the injection times for the dependent MS/MS scans are calculated from the prescan intensities.
- Targeted experiments: the prescan covers the m/z range from the smallest to the largest target. Because analyte intensity changes rapidly as compounds elute, a long target list can leave too much time between the prescan and the later targeted scans, degrading the accuracy of the calculated injection times. The Loop Control setting addresses this: with Loop Control set to Time, a fresh prescan runs at least as often as the chosen interval, keeping injection times (and data quality) accurate.
Resolving Power and Transient Length
Here is a full table of the available resolution settings. Note: higher resolution does not always result in better mass accuracy. The higher the resolution increases your ability to distinguish between m/z ions. As you can see in this table, there is always a trade of higher resolution with time. 15k is the lowest resolution setting, with the fastest scan speed of ~15 Hz; the highest resolution setting is 450K that is <1 Hz.
To fully take advantage of the parallel fill and detect capabilities of the instrument, we need to balance the max fill times with the transient length. For resolving power 30,000, detection time is about 64 ms. There is always a small amount of inter-scan delay. Up to 54 ms can be used to fill the C-trap with ions- and without increasing cycle time.
In SW version 2.1 50k resolution OT scans for TMT 10plex experiments shows a ~10% improvement over 60k resolution. We successfully used 30k resolution as well.
| Res. at m/z 200 | Transient length [ms] | Approx. scan speed [Hz] | “Free” fill time [ms] |
|---|---|---|---|
| 15,000 | 32 | na | 22 |
| 30,000 | 64 | 15 | 54 |
| 50,000 | 96 | na | 86 |
| 60,000 | 128 | 7.5 | 118 |
| 120,000 | 256 | 4 | 246 |
| 240,000 | 512 | 2 | 502 |
| 450,000 | 1024 | <1 | 1014 |
Hela digest concentration curve
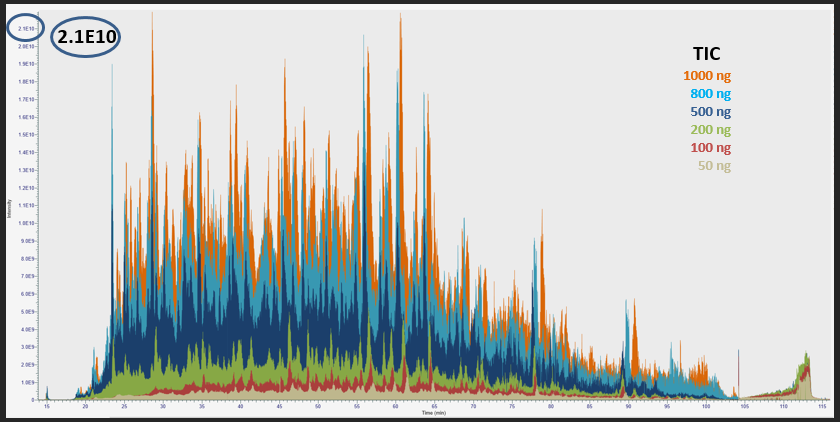
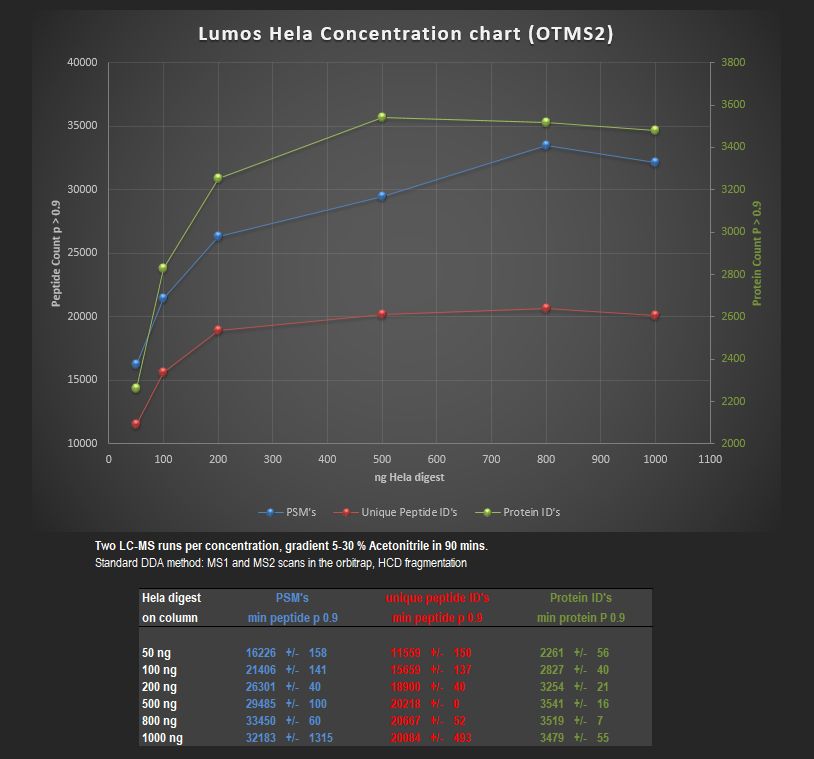
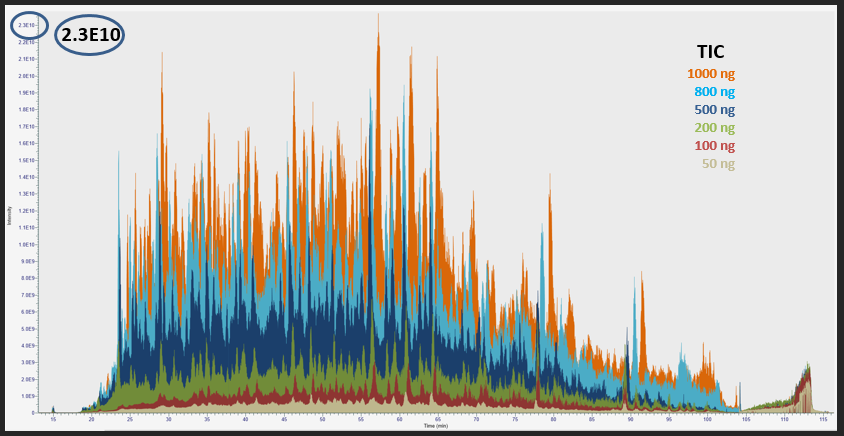
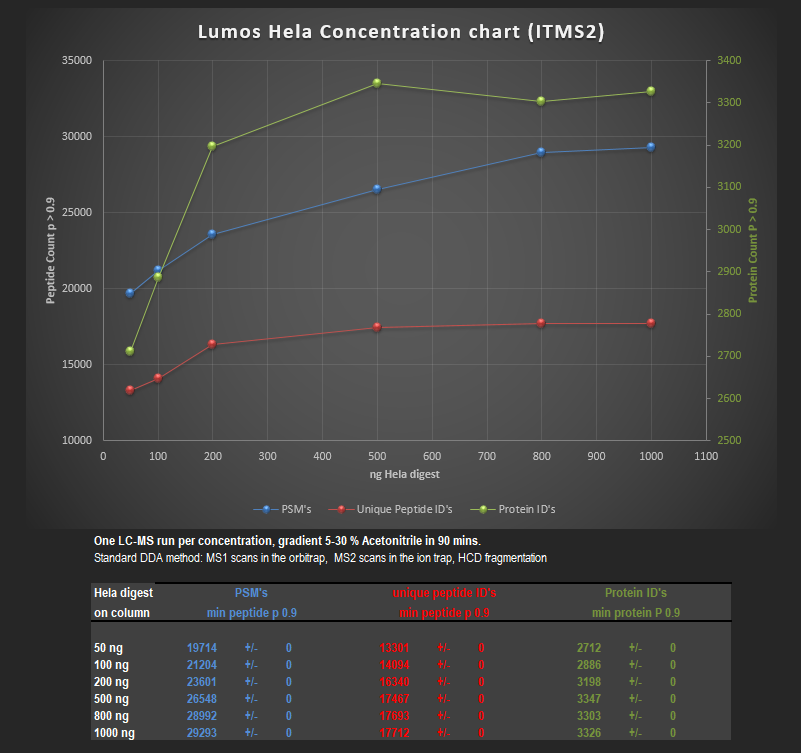
Different concentrations of Pierce HeLa Protein Digest Standard (50, 100, 200, 500, 800, 1000 ng) were injected and separated with a 5-35% acetonitrile gradient over 90 min. Peptides were identified with our standard DDA method and search tools.
TIC (total ion chromatogram) of the different concentrations overlay, normalized to 1000 ng chromatogram.
TIC (total ion chromatogram) of the different concentrations overlay, normalized to 1000 ng chromatogram.