DIA
Data Independent Acquisition
Data Independent Acquisition (DIA) strategies acquire MS/MS scans systematically, independent of precursor information. Unlike targeted parallel reaction monitoring (PRM) and selected reaction monitoring (SRM) strategies, DIA requires no prior knowledge of the target peptides or proteins, and thus less investment in assay development than targeted proteomics applications.
There are various strategies for acquiring and analyzing DIA data. In principle, data are acquired by isolating and fragmenting successive m/z windows and acquiring all the fragment ions in one scan. Typically the isolation windows are selected to cover the tryptic peptide m/z range within a certain time frame. There are many factors to consider, such as instrument type, scan speed, chromatography, and data analysis tools. Depending on the isolated m/z range, the fragmentation spectra are chimeras of multiple precursor ions, and the increased MS/MS spectral complexity has been a major challenge for DIA data analysis tools.
Targeted approaches like PRM and SRM are limited to a handful of peptides without acquisition scheduling, or tens to hundreds of peptides per LC-MS run with scheduling. DIA, on the other hand, allows the measurement of much larger numbers of peptides (thousands, or even whole proteomes).
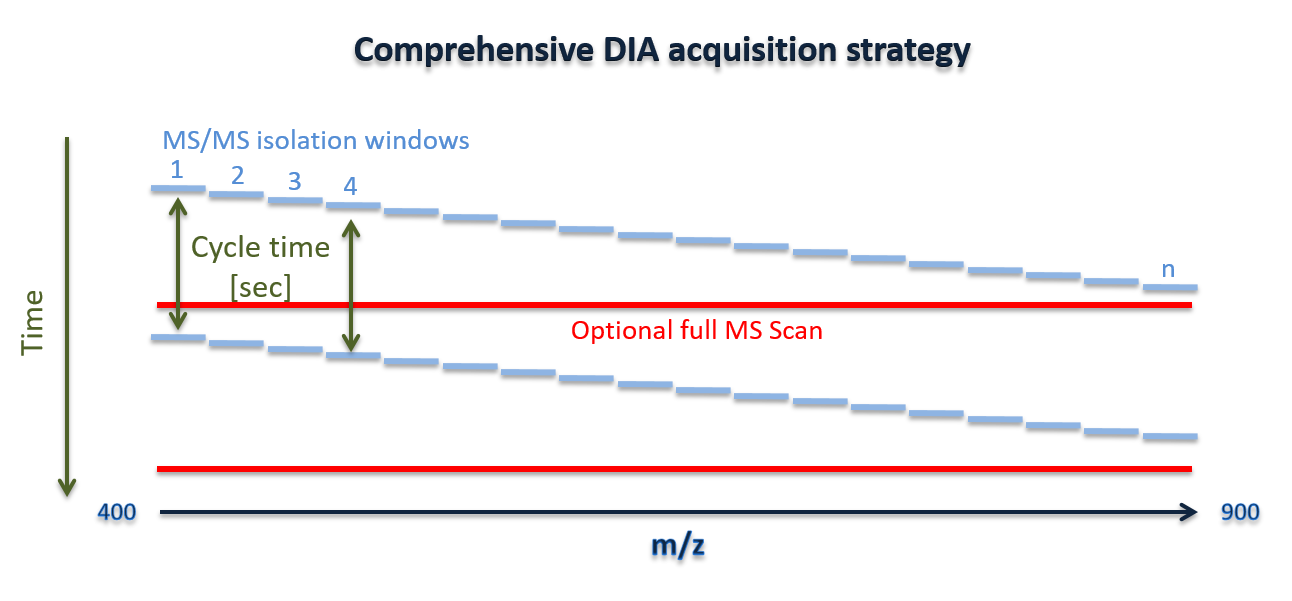
Figure 1: DIA acquisition strategy. Precursor ions are isolated in small windows (typically 5-20 m/z) and fragmented, and the fragment ions are analyzed in MS/MS scans spanning the full m/z range. The total cycle time is the time it takes to step through all the isolation windows. Full MS scans between the DIA MS/MS scans are optional.
DIA assay development
DIA isolation schema: Things to consider
For Thermo instruments you need to specify the center mass of the isolation window as well as the isolation width. The instrument software will populate the isolation list for you; all you need is the start and end m/z and the isolation width.
- Type of instrument (scan speed, resolution, fragmentation, etc.)
- Precursor m/z range: e.g. if you are working with tryptic peptides it is reasonable to cover an m/z range of 400-900
- Isolation width: narrower isolation widths reduce the MS/MS spectral complexity and increase the sensitivity, but increase the cycle time
- Chromatography, i.e. peak width
- Cycle time: the total cycle time is defined by the time it takes to cycle through the entire isolation m/z range, and it determines how many scans are acquired across the chromatographic peak. For quantification, ideally 10-15 points across the peak should be acquired; for peaks about 30 seconds wide, target a total cycle time of 2-3 seconds.
You can always run the same sample twice, e.g. covering 400-700 m/z in the first run and 700-1000 m/z in the second run - Ion fill time: keep the maximum injection time below the MS/MS scan time to preserve the fastest cycle time (see the table below)
- Full MS scans are optional but can be very useful for quantification and identification
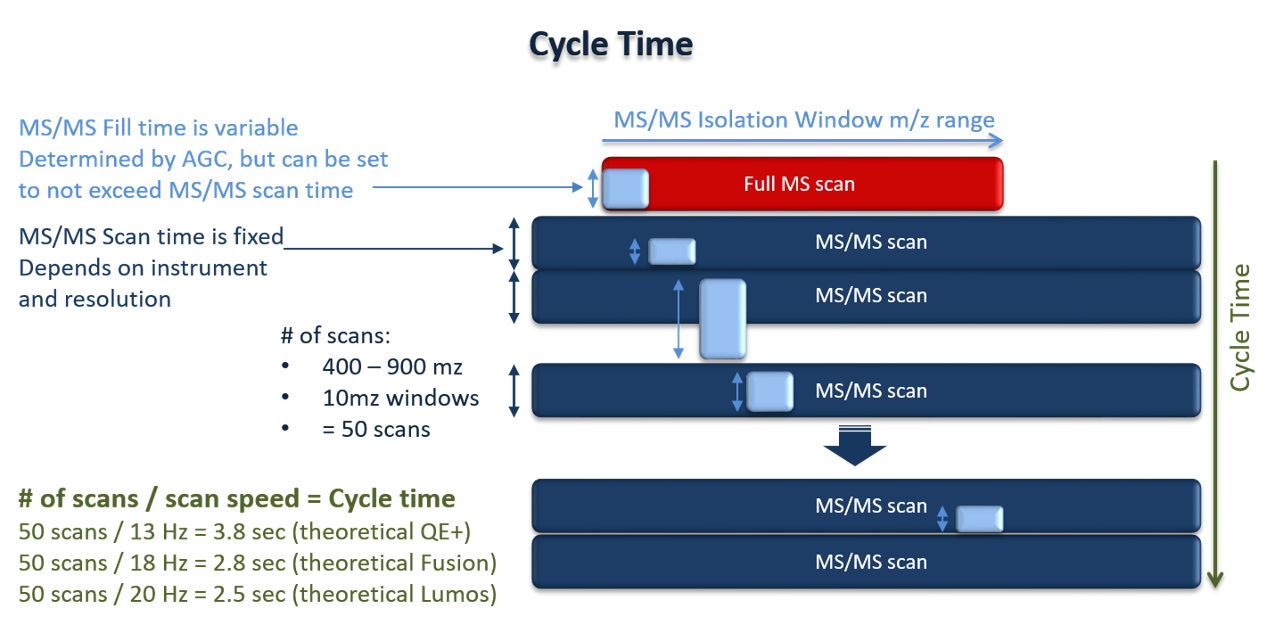
Figure 2: Estimating the total cycle time: the number of isolation windows divided by the scan speed gives the cycle time. The MS/MS scan time is fixed by the instrument and resolution setting, while the fill time is variable and can be set so it does not exceed the scan time. The example calculations use older instruments, but the principle is unchanged on the current fleet.
The table below relates these settings to the two UWPR instruments most commonly used for DIA. On the Orbitrap Exploris 480, DIA MS/MS scans are acquired in the Orbitrap: the resolution setting fixes the transient length, and ions are accumulated in parallel with the previous scan’s detection, so keeping the maximum injection time below the “free” fill time preserves the full scan speed. Higher resolution improves the ability to distinguish nearby m/z ions but costs scan speed. On the Orbitrap Astral, Orbitrap resolution and transient length do not apply to DIA: the MS/MS scans are acquired in the Astral analyzer at a fixed resolution of 80,000 (the Orbitrap acquires only the full MS scans), and the scan speed is instead set by the maximum injection time, up to 200 Hz. The UWPR Astral DIA method templates use maximum injection times of 3-60 ms depending on sample load.
| Orbitrap Exploris 480 | Orbitrap Astral | ||||
|---|---|---|---|---|---|
| Resolution | Transient length [ms] | "Free" fill time [ms] | Approx. scan speed [Hz] | Max fill time [ms] | Approx. scan speed [Hz] |
| 15,000 | 32 | 22 | 22 | 3 | 200 |
| 30,000 | 64 | 54 | 13 | 5 | 200 |
| 45,000 | 96 | 86 | 9 | 7 | 140 |
| 60,000 | 128 | 118 | 7 | 10 | 100 |
| 120,000 | 256 | 246 | 4 | 14 | 70 |
| 240,000 | 512 | 502 | 2 | 20 | 50 |
| 480,000 | 1024 | 1014 | <1 | 60 | 17 |
The two halves of the table are independent. The Exploris 480 rows pair each Orbitrap resolution setting (specified at m/z 200) with its transient length, fastest parallel fill time, and resulting scan speed. The Astral analyzer’s resolution is fixed, so its columns simply list typical maximum injection times and the approximate scan speeds they allow.