Parallel Reaction Monitoring (PRM)
Targeted Proteomics by Parallel-Reaction Monitoring
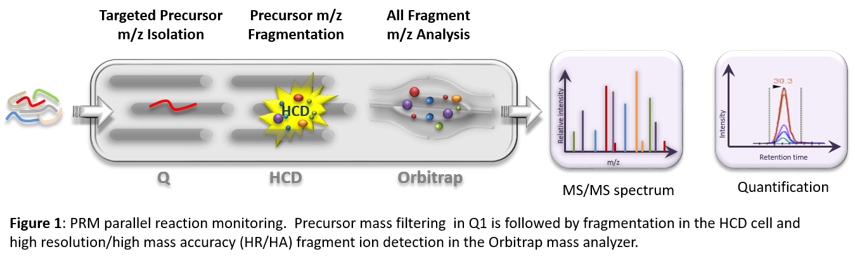
Parallel reaction monitoring (PRM)-based targeted mass spectrometry is comparable in performance to selected reaction monitoring (SRM) but requires much less investment in assay development for targeted proteomics applications.
PRM uses the quadrupole of an Orbitrap instrument to isolate a target precursor ion, fragments the precursor in the collision cell, and detects the resulting product ions in the Orbitrap mass analyzer. Quantification is carried out after data acquisition by extracting several fragment ions with narrow (5 to 10 ppm) mass windows. Optionally, a full scan can be acquired as well, and the precursor mass extracted to complement the quantification.
PRM provides high selectivity, high sensitivity, and high-throughput quantification with confident targeted peptide confirmation. It is most suitable for quantifying tens to hundreds of targeted proteins in complex matrices with attomole-level limits of detection.
PRM assay development
Proteins/peptides of interest can be derived from a variety of sources:
- Shotgun proteomics data
- Other data types, e.g. genomics
- Literature
- Proteomics data repositories:
- Phosphopedia for phosphopeptides
- PeptideAtlas
- PRIDE
- PRM calculator for quantitative cross-linking analysis at XLinkDB
1. Selection of signature or proteotypic peptide(s):
- Peptide(s) should be unique to the protein of interest
- Peptide(s) should be easily detectable by LC-MS analysis
- Peptide length about 5-25 amino acids
- Both ends of the peptide match enzymatic cleavage sites, e.g. if you plan to use trypsin the peptide should have tryptic ends
- Avoid missed cleavage sites
- Avoid ragged ends: two enzymatic sites sequential to each other
- For heavy labeled peptides check with the vendor for restrictions
- Avoid frequently modified amino acids (Met oxidation, deamidation, alkylation, phosphorylation, glycosylation sites, proteolysis, etc.)
Some chemically induced modifications:- Met and Trp: oxidation
- N-terminal Glu: pyroglutamic acid under acidic conditions
- Asn and Gln: deamidation to Asp and Glu, particularly if followed in sequence by Gly or Pro
- Check for known protein modifications (signal peptide, isoforms, cleavage sites, etc.)
2. Peptide fragment selection:
- Assay development effort is greatly reduced since no target fragment ions need to be preselected; the entire MS/MS spectrum is acquired for every precursor
3. Optimize the cycle time:
- The total cycle time is defined by the time it takes to cycle through the entire target list, and it determines how many scans are acquired across the chromatographic peak
- The number of targets and the chromatographic peak widths dictate the ideal cycle time. For quantification, ideally 10-15 points across the peak should be acquired; for peaks about 30 seconds wide, target a total cycle time of 2-3 seconds
- Ion fill time: keep the maximum injection time below the MS/MS scan time to preserve the fastest cycle time (see the table below). The ion time can also be customized for every precursor, e.g. set higher for very low abundance targets to ensure the AGC target is reached
- The maximum number of targeted precursors is therefore the cycle time divided by the scan time
- If the retention times are known, scheduling allows more targets per run
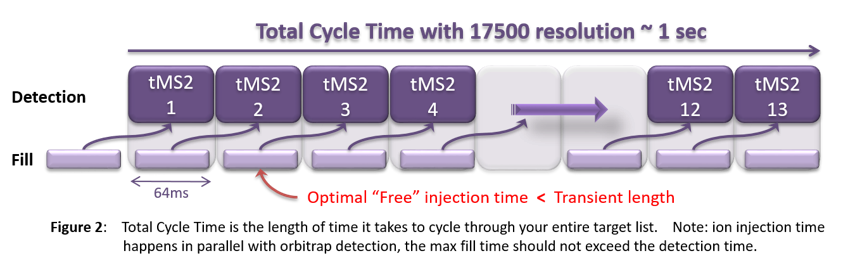
The table below relates the resolution setting to the achievable fill time and scan speed on the two UWPR instruments most commonly used for PRM. The MS/MS scans are acquired in the Orbitrap: the resolution setting fixes the transient length, and ions are accumulated in parallel with the previous scan’s detection, so keeping the maximum injection time below the “free” fill time preserves the full scan speed. Higher resolution improves the ability to distinguish nearby m/z ions but costs scan speed.
| Orbitrap Fusion Lumos | Transient length [ms] |
Orbitrap Exploris 480 | ||||
|---|---|---|---|---|---|---|
| Resolution | "Free" fill time [ms] | Approx. scan speed [Hz] | Resolution | "Free" fill time [ms] | Approx. scan speed [Hz] | |
| 15,000 | 22 | 18 | 32 | 15,000 | 22 | 22 |
| 30,000 | 54 | 15 | 64 | 30,000 | 54 | 13 |
| 96 | 45,000 | 86 | 9 | |||
| 60,000 | 118 | 7.5 | 128 | 60,000 | 118 | 7 |
| 120,000 | 246 | 4 | 256 | 120,000 | 246 | 4 |
| 240,000 | 502 | 2 | 512 | 240,000 | 502 | 2 |
| 450,000 | 1014 | <1 | 1024 | 480,000 | 1014 | <1 |
Resolutions are specified at m/z 200. The two instruments share the central transient column: each row pairs the resolution settings with that transient length, the fastest parallel fill time, and the resulting scan speed.
For example, at a resolution of 15,000 with a maximum injection time of 22 ms, the Fusion Lumos acquires about 18 scans per second and the Exploris 480 about 22. The table below translates these scan speeds into the number of targets that fit in a given cycle time.
| Cycle time [sec] | Fusion Lumos [# of scans] | Exploris 480 [# of scans] |
|---|---|---|
| 1 | 18 | 22 |
| 2 | 36 | 44 |
| 3 | 54 | 66 |
| 4 | 72 | 88 |
| 5 | 90 | 110 |
| 6 | 108 | 132 |
| 7 | 126 | 154 |
| 8 | 144 | 176 |
| 9 | 162 | 198 |
| 10 | 180 | 220 |