SRM
Targeted Proteomics by Selected Reaction Monitoring
Selected reaction monitoring (SRM) is a highly sensitive and selective method for the targeted quantitation of peptides and, by inference, the corresponding proteins in complex biological samples. SRM is also commonly called multiple reaction monitoring (MRM); the two names describe the same experiment, and SRM is used throughout this page.
Most mass spectrometry based proteomics experiments aim at detecting all proteins in a biological sample in an unfocused fashion. SRM, however, is a targeted approach that looks specifically for peptides of interest and their corresponding fragments, allowing for greater specificity and sensitivity in quantification. The specific pairs of mass to charge (m/z) values associated with the peptide precursor and fragment ions are referred to as transitions.
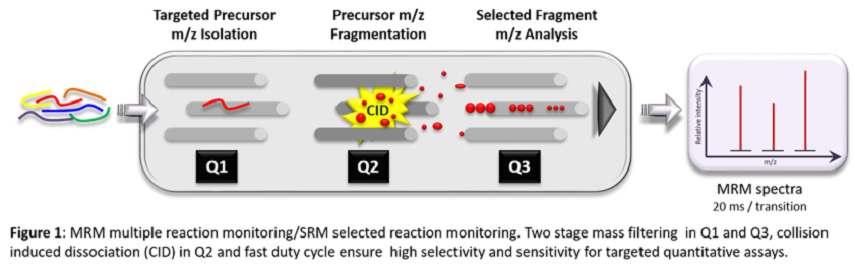
Various types of instruments capable of two stages of mass filtering can be used for SRM assays. Commonly, triple quadrupole mass spectrometers are used: a quadrupole mass analyzer (Q1) isolates the precursor (peptide) ion of interest, the precursor ion population is fragmented in the collision cell (Q2) to yield product ions, and a small number of sequence specific fragment ions are analyzed in the second quadrupole mass analyzer (Q3). This two-stage mass filtering combined with the fast scan rate results in unmatched sensitivity and selectivity for quantitative analyses. SRM improves the lower detection limit for peptides by up to 100-fold compared to untargeted full-scan MS/MS analyses.
SRM assay development
Proteins/peptides of interest can be derived from a variety of sources:
- Shotgun proteomics data
- Other data types, e.g. genomics
- Proteomics data repositories
- Literature
1. Selection of signature or proteotypic peptide(s):
- Peptide(s) should be unique to the protein of interest
- Peptide(s) should be easily detectable by LC-MS analysis
- Peptide length about 5-25 amino acids
- Both ends of the peptide match enzymatic cleavage sites, e.g. if you plan to use trypsin the peptide should have tryptic ends
- Avoid missed cleavage sites
- Avoid ragged ends: two enzymatic sites sequential to each other
- For heavy labeled peptides check with the vendor for restrictions
- Avoid frequently modified amino acids (Met oxidation, deamidation, alkylation, phosphorylation, glycosylation sites, proteolysis, etc.)
Some chemically induced modifications:- Met and Trp: oxidation
- N-terminal Glu: pyroglutamic acid under acidic conditions
- Asn and Gln: deamidation to Asp and Glu, particularly if followed in sequence by Gly or Pro
- Check for known protein modifications (signal peptide, isoforms, cleavage sites, etc.)
2. Peptide fragment selection:
- Fragments should be specific to the peptide of interest
- Select y-ions with higher m/z (various contaminant ions, such as solvent ions and polysiloxanes, populate the low m/z range)
- b-ions are often of low abundance or absent in triple quadrupole fragment spectra
- MS/MS signal intensity: the intensities of individual fragments derived from one precursor ion differ substantially. To obtain a high-sensitivity assay, it is therefore essential to select transitions specific for the most intense fragments
3. Optimization for each transition to maximize signal response/sensitivity:
-
Collision energy: optimizing the collision energy for each transition may increase overall sensitivity, but it is only really needed if the sensitivity is very low or below the limit of detection (LOD)
Base collision energy (CE) equations for the TSQ Altis (based on the template method from Thermo):
- TSQ Altis (1.5 mTorr) 2+ peptide: CE = 0.034 x m/z + 2.2835
- TSQ Altis (1.5 mTorr) 3+ peptide: CE = 0.0295 x m/z + 1.4831
Base collision energy (CE) equations for the TSQ Quantiva (based on Skyline):
- TSQ Quantiva 2+ peptide: CE = 0.0339 x m/z + 2.3597
- TSQ Quantiva 3+ peptide: CE = 0.0295 x m/z + 1.5123
Base collision energy (CE) equations (Ref 1):
- TSQ Vantage (1.0 mTorr) 2+ peptide: CE = 0.041 x m/z - 3.442
- TSQ Vantage (1.0 mTorr) 3+ peptide: CE = 0.040 x m/z + 0.773
- TSQ Vantage (1.5 mTorr) 2+ peptide: CE = 0.030 x m/z + 2.905
- TSQ Vantage (1.5 mTorr) 3+ peptide: CE = 0.038 x m/z + 2.281
- TSQ Access (1.0 mTorr) 2+ peptide: CE = 0.049 x m/z - 5.750
- TSQ Access (1.0 mTorr) 3+ peptide: CE = 0.039 x m/z + 3.314
4. Validation of the SRM assay:
- Confirm peptide identity, e.g. by acquiring a full MS2 spectrum of the peptide in the triple quadrupole instrument used for SRM
5. Extraction of the final coordinates of the SRM assay, including:
- Selected peptide and charge state
- Peptide fragments
- Corresponding m/z ratios
- Fragment intensity ratios
- Collision energy for each transition
- Chromatographic elution time, to be optionally used in scheduled SRM analyses
Although this is a lengthy and iterative process, it has to be established only once for each peptide/protein for a given type of mass spectrometer and fragmentation mechanism (e.g. collision-induced dissociation).
How many transitions can I monitor?
During the method development phase, retention times are typically unknown and all the transitions are monitored continuously throughout the entire LC-MS run. Approximately 100 peptides per hour, or more than 250 proteins per day (with 5 peptides per protein), can be monitored. Synthetic peptides are often used to establish the assay coordinates.
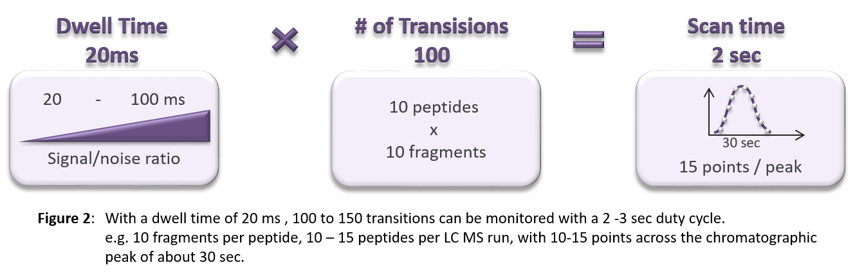
- Sampling rate: for quantification, ideally 10-15 points across the chromatographic peak should be acquired. If the average peak elutes in 30 seconds, target a duty cycle of 2-3 seconds
- Dwell (fragment ion scan) time: on a triple quadrupole instrument, longer dwell times yield better signal to noise ratios. On the UWPR instrument we usually use a minimum of 20 ms, with a range of 20-100 ms
- The number of transitions is therefore the duty cycle divided by the dwell time
Figure 2 shows an overview of how to calculate the number of transitions.
Once the SRM assay is established, we typically monitor 3-4 fragments per peptide and use timed windows for each peptide (scheduling), reducing the number of transitions monitored at any given moment during the gradient. With scheduled methods, more peptides and transitions can be monitored per LC-MS analysis while maintaining a duty cycle that produces a fast enough sampling rate across the chromatographic peak. With scheduled SRM, an analyte measurement rate of 1,000 transitions per hour and about 600 protein measurements per day can be achieved.
Analytical characteristics of SRM assays
Sensitivity (limit of quantification, LOQ)
- About 50 copies per cell in yeast whole cell extracts without fractionation (Ref 2)
- About 0.3-1 ug/mL in undepleted human plasma without fractionation (Refs 3-5)
- Below 10 copies per cell (theoretical) in yeast cells with peptide OGE (Ref 2)
- About 1,200 copies per cell in mammalian cells with nuclei/cytoplasm separation (Ref 6)
- 1-10 ng/mL in human body fluids with depletion combined with strong or mixed-mode cation exchange, SISCAPA, or glycocapture (Refs 7-12)
- 0.1-1 ng/mL in human body fluids with immunoprecipitation or glycoprotein isolation plus SISCAPA (Refs 13, 14)
Precision
Mostly below 15-20% CV, with or without fractionation (Refs 2, 5, 7, 10, 13, 15)
Specificity
Isoforms and single amino acid mutations can easily be distinguished (Refs 16-19)
References
- Effect of collision energy optimization on the measurement of peptides by selected reaction monitoring (SRM) mass spectrometry. MacLean B, et al. Anal Chem. 2010;82(24):10116-24. PubMed link
- Full dynamic range proteome analysis of S. cerevisiae by targeted proteomics. Picotti P, et al. Cell. 2009;138(4):795-806. PubMed link
- Quantitative mass spectrometric multiple reaction monitoring assays for major plasma proteins. Anderson L, Hunter CL. Mol Cell Proteomics. 2006;5(4):573-88. PubMed link
- Multiple reaction monitoring-based, multiplexed, absolute quantitation of 45 proteins in human plasma. Kuzyk MA, et al. Mol Cell Proteomics. 2009;8(8):1860-77. PubMed link
- Multi-site assessment of the precision and reproducibility of multiple reaction monitoring-based measurements of proteins in plasma. Addona TA, et al. Nat Biotechnol. 2009;27(7):633-41. PubMed link
- Synthetic peptide arrays for pathway-level protein monitoring by liquid chromatography-tandem mass spectrometry. Hewel JA, et al. Mol Cell Proteomics. 2010;9(11):2460-73. PubMed link
- High sensitivity detection of plasma proteins by multiple reaction monitoring of N-glycosites. Stahl-Zeng J, et al. Mol Cell Proteomics. 2007;6(10):1809-17. PubMed link
- Quantitative, multiplexed assays for low abundance proteins in plasma by targeted mass spectrometry and stable isotope dilution. Keshishian H, et al. Mol Cell Proteomics. 2007;6(12):2212-29. PubMed link
- Clinical quantitation of prostate-specific antigen biomarker in the low nanogram/milliliter range by conventional bore liquid chromatography-tandem mass spectrometry (multiple reaction monitoring) coupling and correlation with ELISA tests. Fortin T, et al. Mol Cell Proteomics. 2009;8(5):1006-15. PubMed link
- Quantification of thyroglobulin, a low-abundance serum protein, by immunoaffinity peptide enrichment and tandem mass spectrometry. Hoofnagle AN, et al. Clin Chem. 2008;54(11):1796-804. PubMed link
- Developing multiplexed assays for troponin I and interleukin-33 in plasma by peptide immunoaffinity enrichment and targeted mass spectrometry. Kuhn E, et al. Clin Chem. 2009;55(6):1108-17. PubMed link
- Cancer genetics-guided discovery of serum biomarker signatures for diagnosis and prognosis of prostate cancer. Cima I, et al. Proc Natl Acad Sci U S A. 2011;108(8):3342-7. PubMed link
- Use of an immunoaffinity-mass spectrometry-based approach for the quantification of protein biomarkers from serum samples of lung cancer patients. Nicol GR, et al. Mol Cell Proteomics. 2008;7(10):1974-82. PubMed link
- Increased throughput for low-abundance protein biomarker verification by liquid chromatography/tandem mass spectrometry. Berna M, Ackermann B. Anal Chem. 2009;81(10):3950-6. PubMed link
- An automated and multiplexed method for high throughput peptide immunoaffinity enrichment and multiple reaction monitoring mass spectrometry-based quantification of protein biomarkers. Whiteaker JR, et al. Mol Cell Proteomics. 2010;9(1):184-96. PubMed link
- Targeted proteomics using selected reaction monitoring reveals the induction of specific terpene synthases in a multi-level study of methyl jasmonate-treated Norway spruce (Picea abies). Zulak KG, et al. Plant J. 2009;60(6):1015-30. PubMed link
- Comprehensive quantitative analysis of central carbon and amino-acid metabolism in Saccharomyces cerevisiae under multiple conditions by targeted proteomics. Costenoble R, et al. Mol Syst Biol. 2011;7:464. PubMed link
- Mutant proteins as cancer-specific biomarkers. Wang Q, et al. Proc Natl Acad Sci U S A. 2011;108(6):2444-9. PubMed link
- Quantitation of human glutathione S-transferases in complex matrices by liquid chromatography/tandem mass spectrometry with signature peptides. Zhang F, Bartels MJ, Stott WT. Rapid Commun Mass Spectrom. 2004;18(4):491-8. PubMed link